Understanding El Niño-Southern Oscillation Complexity
El Niño events are characterized by tropical Pacific surface warming and weakening of trade winds occurring every few years. Such conditions are accompanied by changes in atmospheric and oceanic circulation, affecting global climate, marine and terrestrial ecosystems, fisheries and human activities. The alternation of warm El Niño and cold La Niña conditions, referred to as the El Niño-Southern Oscillation (ENSO), represents the strongest year-to-year fluctuation of the global climate system. A Nature review paper published recently (Timmermann et al. 2018) provides a synthesis of the current understanding of the spatio-temporal complexity (In terms of amplitude, timing, duration, predictability and global impacts) of this important climate mode and its influence on the earth system. The paper proposes a unifying framework to explain ENSO spatio-temporal complexity, by considering the two most dominant coupled modes of variability on about two-year and four-year time scales. Read the full article at the following link. The CSIRO blog highlighting six reasons you should care about El Niño is also recommended reading.
Find out more about CSHOR ENSO and the IOD research on the project page.
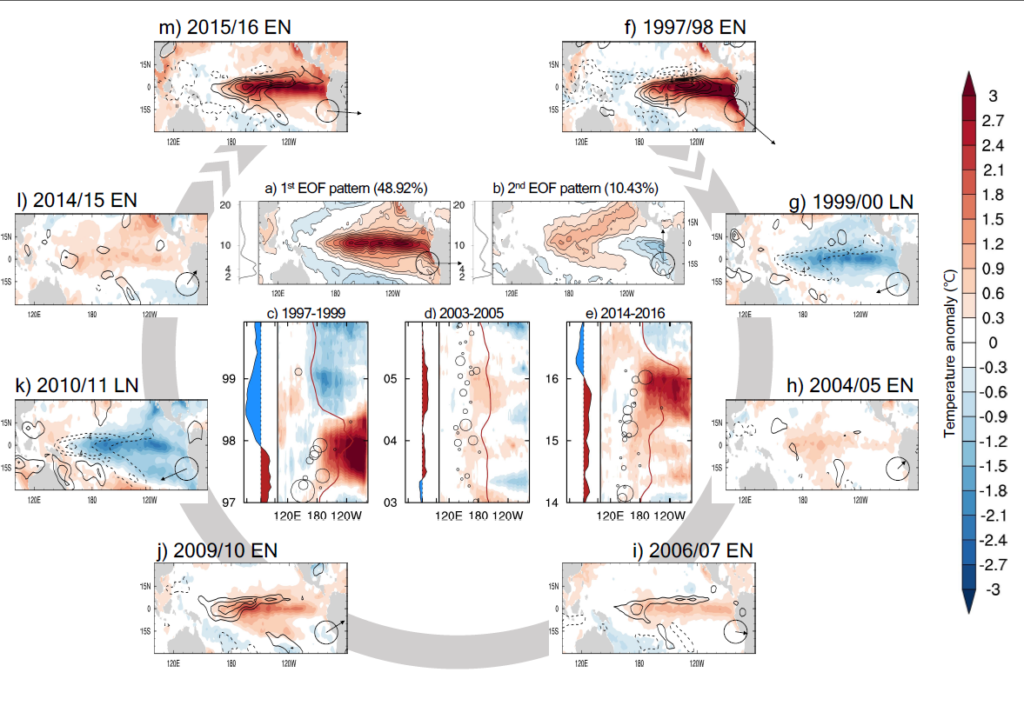 Figure: Spatio-temporal complexity of ENSO. 1st (a) 2nd 490 (b) EOF patterns of linearly detrended SSTA computed for 25°S-25°N, 140°E-80°W during 1920-2016, with associated variance-preserving spectral power density on the left (vertical axis is period in years, horizontal axis is log power); c,d,e) longitude-time evolution of Pacific SSTA averaged 5°S-5°N, for selected observed ENSO events, with 28.5°C isotherm of SST (red curve) representing the edge of the Western Pacific Warm Pool, longitude and strength of WWEs (black circles), and (on the left) associated equatorial Pacific heat content anomaly (temperature anomaly averaged over the top 300 m of the ocean and between 5°S-5°N and 120°E-90°W; range from -1 to 1K; red positive, blue negative). (f-m) spatial pattern of SSTA (shaded) and precipitation anomaly (contours, positive solid, negative dashed, 2 mm/day interval, zero contour omitted) averaged over the Nov-Dec-Jan season of selected ENSO events. Note that strong warm events (1997/98, 2015/16) induce very strong eastward and equatorward shifts of rainfall. Bottom-right of each panel of (a,b,f-m): associated principal components (PCs), namely the projection of each SSTA spatial pattern onto the EOF patterns in (a,b); abscissa is PC1, ordinate is PC2, and arrow length is relative to the unit circle.