Reconciling global mean and regional sea level change in projections and observations
A study led by Ocean University of China and CSHOR student, Jinping Wang, and published in Nature Communications, finds climate model projections of sea level rise in the early 21st century are in good agreement with sea level data recorded in the corresponding period.
The CSHOR sea level project team compared the global and regional sea level projections of two reports – the Intergovernmental Panel on Climate Change (IPCC) Fifth Assessment Report (AR5) and the Special Report on the Ocean and Cryosphere in a Changing Climate (IPCC-SROCC) – with the observed global and coastal sea level data gathered from satellites and from a network of 177 tide-gauges during 2007 to 2018. Trends of the AR5 and SROCC sea level projections under three different scenarios of greenhouse gas emissions agree with satellite and tide-gauge observations during this period.
Study co-author and CSHOR project leader, Dr Xuebin Zhang, says this is the first study to compare projections of sea level rises at both a global and regional level with observations over their overlapping periods – no mean feat given the natural variability of climate and vertical land movement from region to region.
“We carefully removed the impacts from natural climate variability, for example El Niño– Southern Oscillation, and corrected vertical land movement, which led to much improved agreement,” said Dr Zhang.
Due to the short comparison period of 11 years, Prof John Church, study co-author from The University of New South Wales, and CSHOR collaborator, is hesitant to extend the same degree of confidence over the longer term, from the end of this century and beyond. Acceleration of ice-sheet contribution to sea level rise is less understood and could lead to larger rises.
“There remains a potential for larger sea level rises, particularly beyond 2100 for high emission scenarios. Therefore, it is vital that we still try to meet the commitments of the Paris Agreement by urgently and significantly reducing emissions,” said Prof Church.
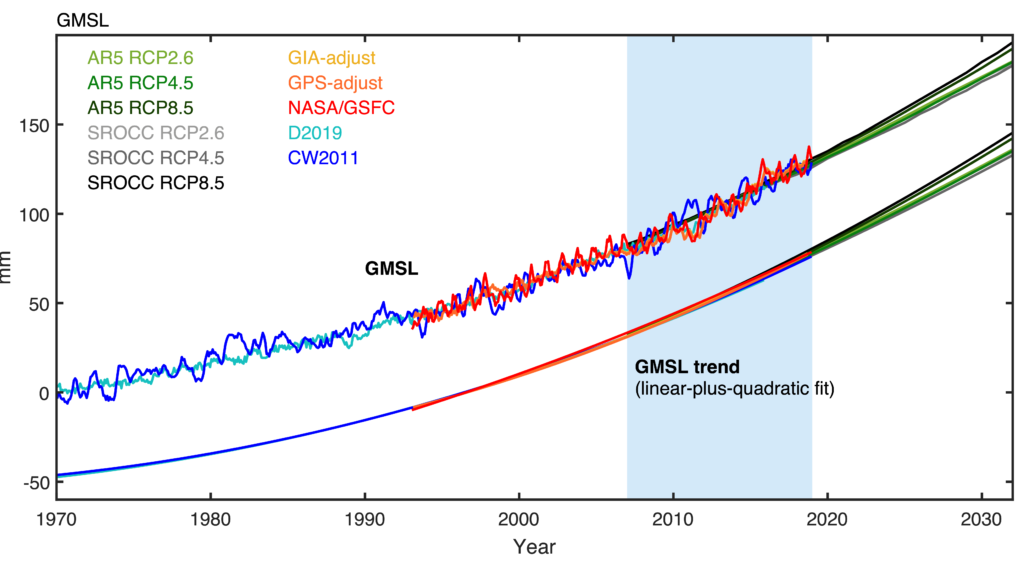
Figure: the global-mean sea level (GMSL) from observations compared with projections. Monthly satellite altimeter observations (1993–2018), with instrumental drifts corrected, from CSIRO, are based on glacial isostatic adjustment (GIA-adjust; yellow) and Global Positioning System (GPS-adjust; orange), as well as from NASA (NASA/GSFC; red). The GMSL reconstructions (1970–2018) from ref. 13 (D2019; aqua) and ref. 12 (CW2011; blue) are smoothed with a 5-month running-mean filter. The annual multimodel averaged GMSL projections from the IPCC AR5 (from light green to dark green) and SROCC (from light grey to dark dark grey) under three Representative Concentration Pathway (RCP) scenarios respectively (2007–2032). GMSL trends including both linear and quadratic terms are also shown offset by −50 mm. The blue shaded area indicates the overlapping period between observations and projections (2007–2018).
This research is supported by CSHOR and the Australian Research Council’s Discovery Project funding scheme. Ms Jinping Wang is supported by the China Scholarship Council. Prof Xianyao Chen is supported by the Natural Science Foundation of China.
Quotes from Prof Church and Dr Zhang are obtained from a UNSW Newsroom article. The full article is available here.
This publication was also highlighted at Nature Communications Editors’ Highlights: https://www.nature.com/collections/hcfhgcahdc.
Read the Nature Communications article at this link.