Opposite response of strong and moderate positive Indian Ocean Dipole to greenhouse warming
A new study by Cai, Yang and Wu et al. published today in Nature Climate Change shows that climate extremes seen in 2019-20 are likely to occur more frequently under greenhouse warming. Faster warming in the equatorial northwestern Indian Ocean favours atmosphere convection in the region. Equatorial nonlinear positive feedbacks responsible for the strong cooling in the equatorial eastern Indian Ocean are strengthened. Low-tropospheric warming which is faster than the surface warming is inconducive to Ekman pumping that drives warm anomalies.
A positive Indian Ocean Dipole (pIOD) refers to a west-minus east difference in sea surface temperature (SST) between warm anomalies in the western and cold anomalies in the eastern equatorial Indian Ocean, described by a positive dipole mode index (DMI). A pIOD induces climate and weather extremes in Indian Ocean rim countries including devastating Australian bushfires and African floods, as seen in 2019-20. SST is a fundamentally important expression of the pIOD that determines its impact, but how pIOD SST variability responds to greenhouse warming has been uncertain for decades, owing to a lack of inter-model consensus on the response of the DMI. This study finds a robust future increase in SST variability of strong pIOD events, which feature strong equatorial eastern Indian Ocean cool anomalies, but a robust decrease in SST variability of moderate pIOD events, which are dominated by western pole of warm anomalies. This is seen in majority of climate models participating in the fifth and six phase of Coupled Model Inter-comparison Project (CMIP5 and CMIP6) that simulate the two distinct pIOD regimes. The robust change occurs in terms of the response of anomaly patterns to each model. The conventional DMI imposes a fixed pattern and is unable to account for the distinct response of the two regimes.
The figure below depicts projected opposite response of moderate and strong pIOD SST.
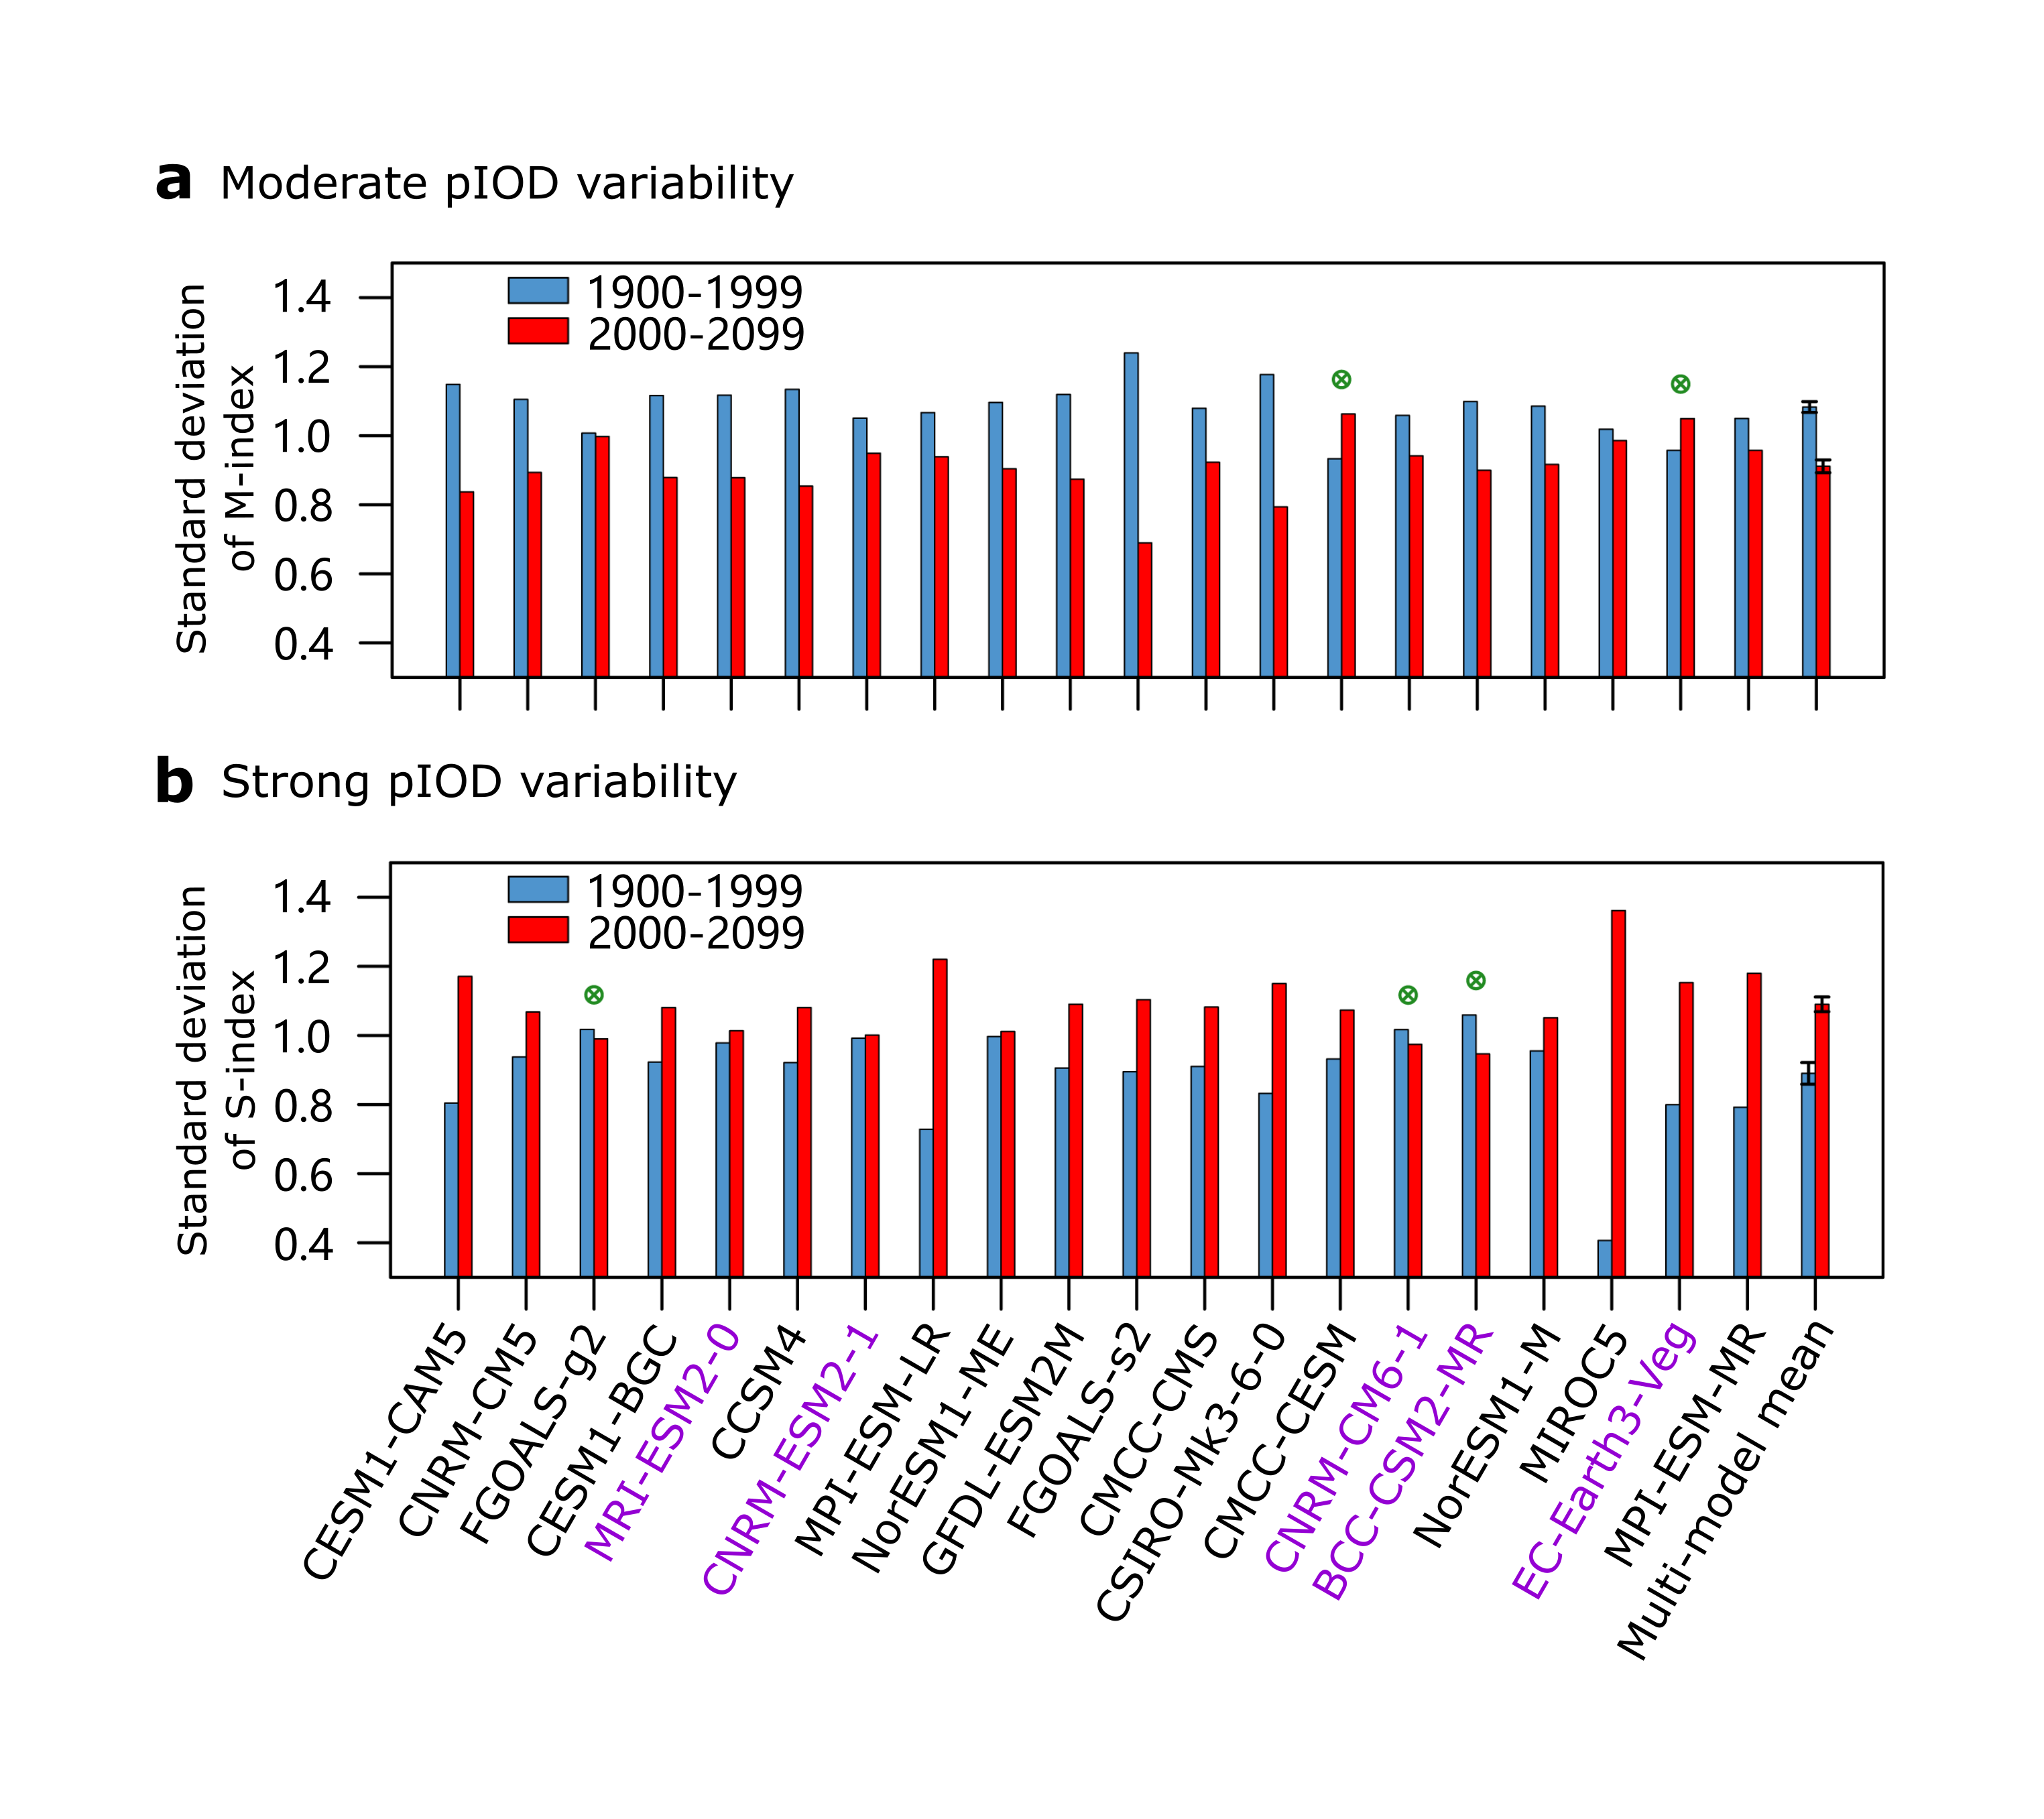
The result shows a decrease in moderate pIOD variability but an increase in strong pIOD variability. a, A total of 18 out of the 20 selected models (90%) generate a reduction in moderate pIOD variability depicted by the M-index from the present-day (1900–1999, blue bars) to future (2000–2099, red bars) climate, with the exception of two models generating an increase (indicated by green circles). The multimodel mean reduction of 16% is statistically significant above the 95% confidence level according to a bootstrap test. The error bars in the multimodel mean represent the 95% confidence level determined by a bootstrap test. b, A total of 17 out of the 20 models (85%) simulate an increase in variability of strong pIOD described by the S-index from the present-day to the future climate, with the exception of three models generating a decrease (indicated by green circles). The multimodel mean increase of 22% is statistically significant above the 95% confidence level according to a bootstrap test. Models from CMIP6 are indicated in purple.
The following media articles discuss the study’s findings: CarbonBrief (USA 30/11/2020); Sydney Morning Herald (Australia 01/12/2020); and The Independent (UK 01/12/2020).
The full article is available at this link.