Changing El Niño–Southern Oscillation in a warming climate
A recent article by Cai et al. (2021), published in Nature Reviews Earth & Environment, synthesises advances in observed and projected changes of multiple aspects of El Niño–Southern Oscillation (ENSO), including the processes behind such changes.
The review finds that models which best capture key ENSO dynamics also tend to project an increase in future ENSO sea surface temperature (SST) variability and, thereby, ENSO magnitude under greenhouse warming, as well as an eastward shift and intensification of ENSO-related atmospheric teleconnections. Such projected changes are consistent with palaeoclimate evidence of stronger ENSO variability since the 1950s compared with past centuries.
The increase in ENSO variability, though underpinned by increased equatorial Pacific upper-ocean stratification, is strongly influenced by internal variability, raising issues about its quantifiability and detectability. The review also shows that ongoing coordinated scientific community efforts and computational advances are enabling long-simulation, large-ensemble experiments, and high-resolution modelling, offering encouraging prospects for alleviating model biases, incorporating fundamental dynamical processes, and reducing uncertainties in projections. The figure below depicts projected increase in ENSO SST variability in CMIP6 models.
Read the review article at this link.
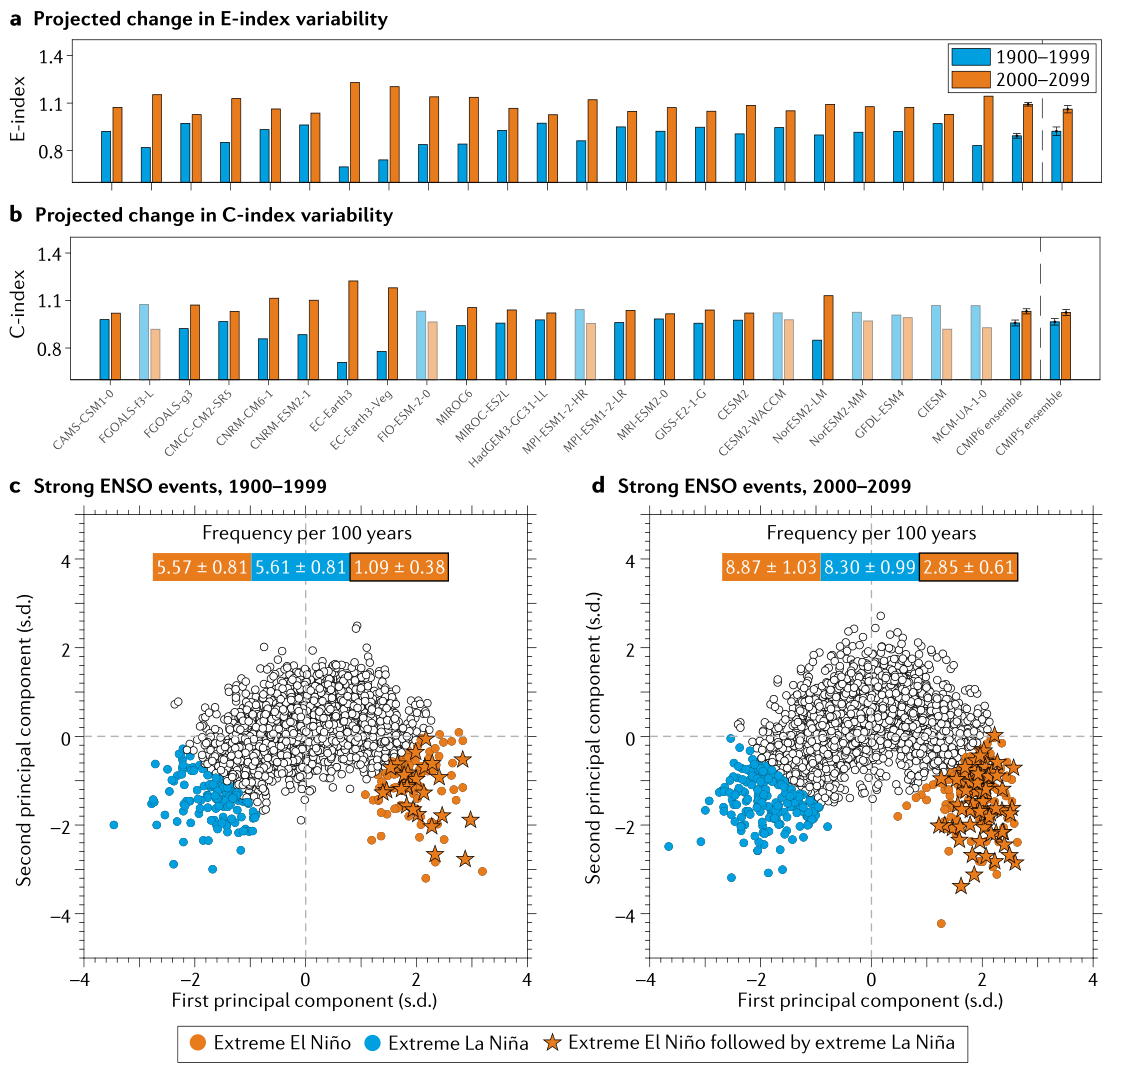
Figure: Projected increase in El Niño–Southern Oscillation sea surface temperature variability in CMIP6 models (Cai et al., 2021)
In panel a, December-January-February E-index standard deviation over the present (1900–1999; blue) and future (2000–2099; orange) periods for 23 CMIP6 models, and the ensemble mean for CMIP6 and CMIP5 models. Error bars for the multi-model means indicate one standard deviation value of 10,000 realizations in a bootstrap test. In panel b, as in panel a, but for the C-index. Transparent bars represent those models that simulate a variance reduction. In panel c, the relationship between the first and second principal component time series of empirical orthogonal function analysis of SST anomalies 1900–1999 for the identification of extreme ENSO events. Orange dots indicate extreme El Niño events (E-index > 1.5 standard deviations), blue dots extreme La Niña events (C-index <= −1.75 standard deviations) and orange stars with black outlines extreme El Niño events with an extreme La Niña event the following year. Numbers indicate the average frequency of event type per 100 years with 90% confidence interval based on a Poisson distribution. In panel d, as in panel c, but for 2000–2099. A stronger inter-model consensus on increased ENSO SST variability emerges in CMIP6 than CMIP5 models. Only those models that simulate ENSO nonlinearity at least 50% of the observed (as indicated by the nonlinear relationship between the first and second principal components of SST variability in the tropical Pacific are selected. Models are forced by historical forcing up to 2014 and, thereafter, the Shared Socioeconomic Pathway 5-8.5 (SSP5-8.5).